In this chapter, we take up the topic of welfare economics, the study of how the allocation of resources affects economic well-being. This analysis leads to a profound conclusion: The equilibrium of supply and demand in a market maximizes the total benefits received by buyers and sellers.
Table of Contents
CONSUMER SURPLUS
Willingness To Pay
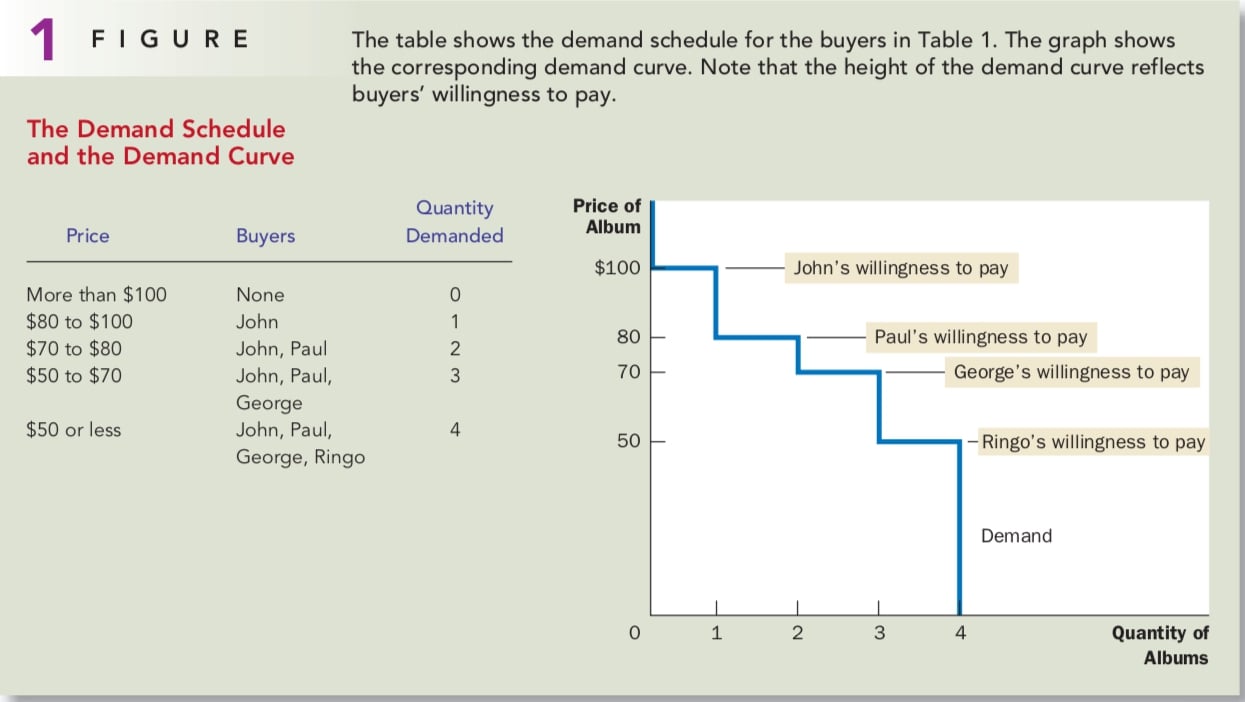
Willingness to pay is the maximum amount that a buyer will pay for a good. Consumer surplus is the amount a buyer is willing to pay for a good minus the amount the buyer actually pays for it. For example, John is willing to pay ¥100 for an album but pays only ¥80 for it. So John receives consumer surplus of ¥20.
Using The Demand Curve To Measure Consumer Surplus
Say John, Paul, George, and Ringo willing to buy an old album. Table 1 shows the maximum price that each of the four possible buyers would pay. The table in Figure 1 shows the demand schedule that corresponds to Table 1.

Because the demand curve reflects buyers’ willingness to pay, we can also use it to measure consumer surplus. Figure 2 uses the demand curve to compute consumer surplus in our two examples.
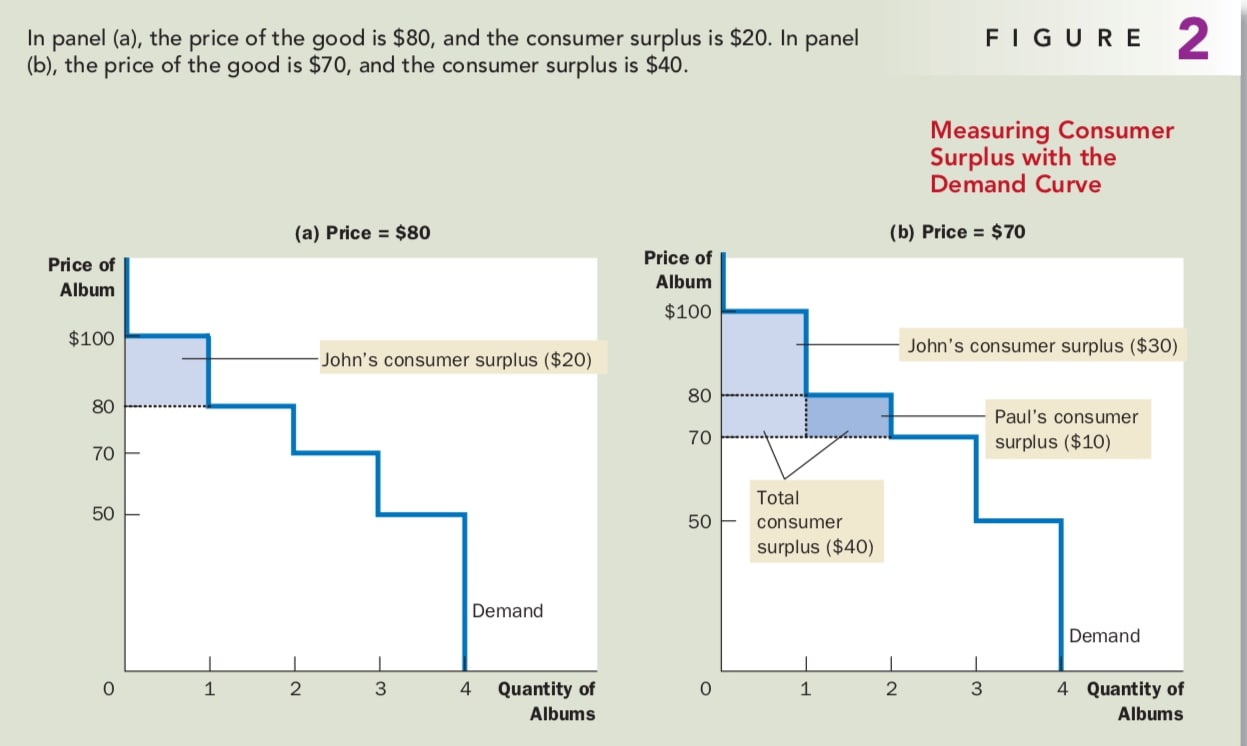
We can find out that the area below the demand curve and above the price measures the consumer surplus in a market. This is true because the height of the demand curve measures the value buyers place on the good, as measured by their willingness to pay for it. The difference between this willingness to pay and the market price is each buyer’s consumer surplus. Thus, the total area below the demand curve and above the price is the sum of the consumer surplus of all buyers in the market for a good or service.
How A Lower Price Raises Consumer Surplus
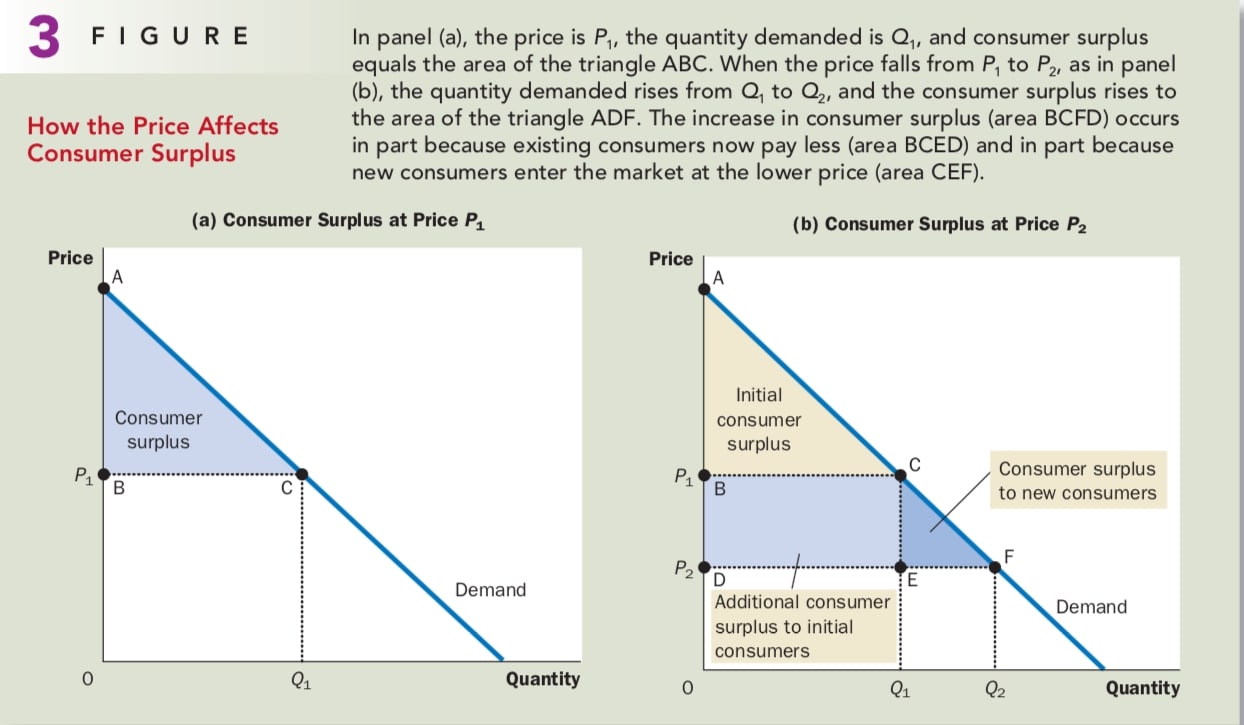
Figure 3 shows a typical demand curve. In panel (a), consumer surplus at a price of P1 is the area of triangle ABC. Now suppose that the price falls from P1 to P2, as shown in panel (b). The consumer surplus now equals area ADF.
This increase in consumer surplus is composed of two parts. First, those buyers who were already buying Q1 of the good at the higher price P1 are better off because they now pay less. It equals the area of the rectangle BCDE. Seconds, some new buyers enter the market. The consumer surplus these newcomers receive is the area of the triangle CEF.
What Does Consumer Surplus Measure?
Consumer surplus, the amount that buyers are willing to pay for a good minus the amount they actually pay for it, measures the benefit that buyers reveille from a good as the buyers themselves perceive it. Thus, consumer surplus is a good measure of economic well-being if policymakers want to respect the preferences of buyers.
PRODUCER SURPLUS
Cost And The Willingness To Sell
A seller’s cost of doing a work is the value of everything the seller must give up to produce a good. Producer surplus is the amount a seller is paid for a good minus the seller’s cost of providing it.
Using The Supply Curve To Measure Producer Surplus
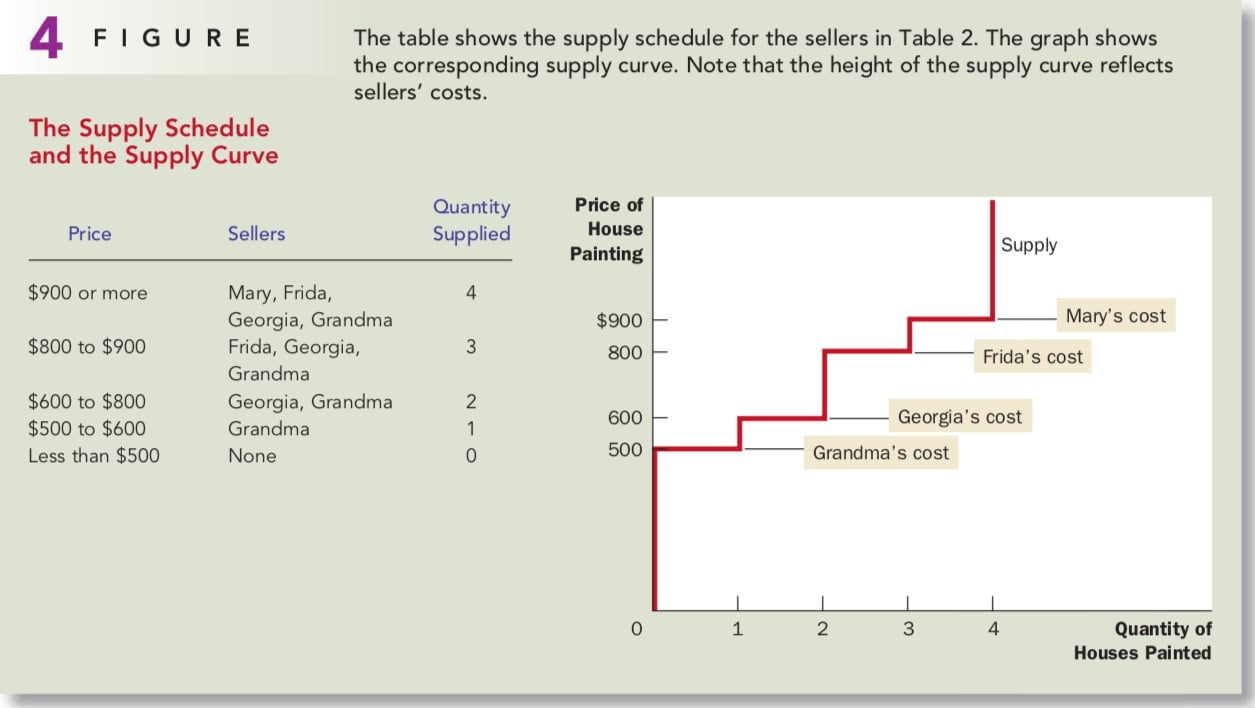
Say there are four painters, Mary, Frida, Georgia, Grandma, compete for painting a house. Table 2 shows the costs of them. 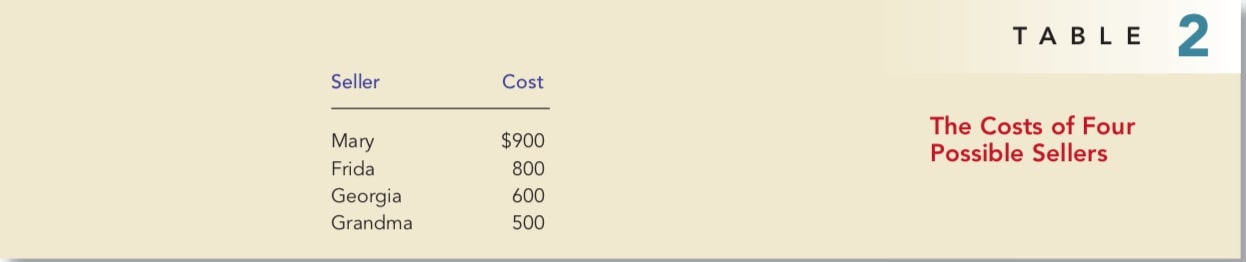
Producer surplus is closely related to the supply curve. The table in Figure 4 shows the supply schedule that corresponds to the costs in Table 2. The graph in Figure 4 shows the supply curve that corresponds to this supply schedule.
Because the supply curve reflects sellers’ cost, we can use it to measure producer surplus, as shown in Figure 5. The area below the price and above the supply curve measures the producer surplus in a market. The logic is straightforward: The height of the supply curve measures sellers’ costs, and the difference between the price and the cost of production is each seller’s producer surplus. Thus, the total area is the sum of the producer surplus of all sellers. 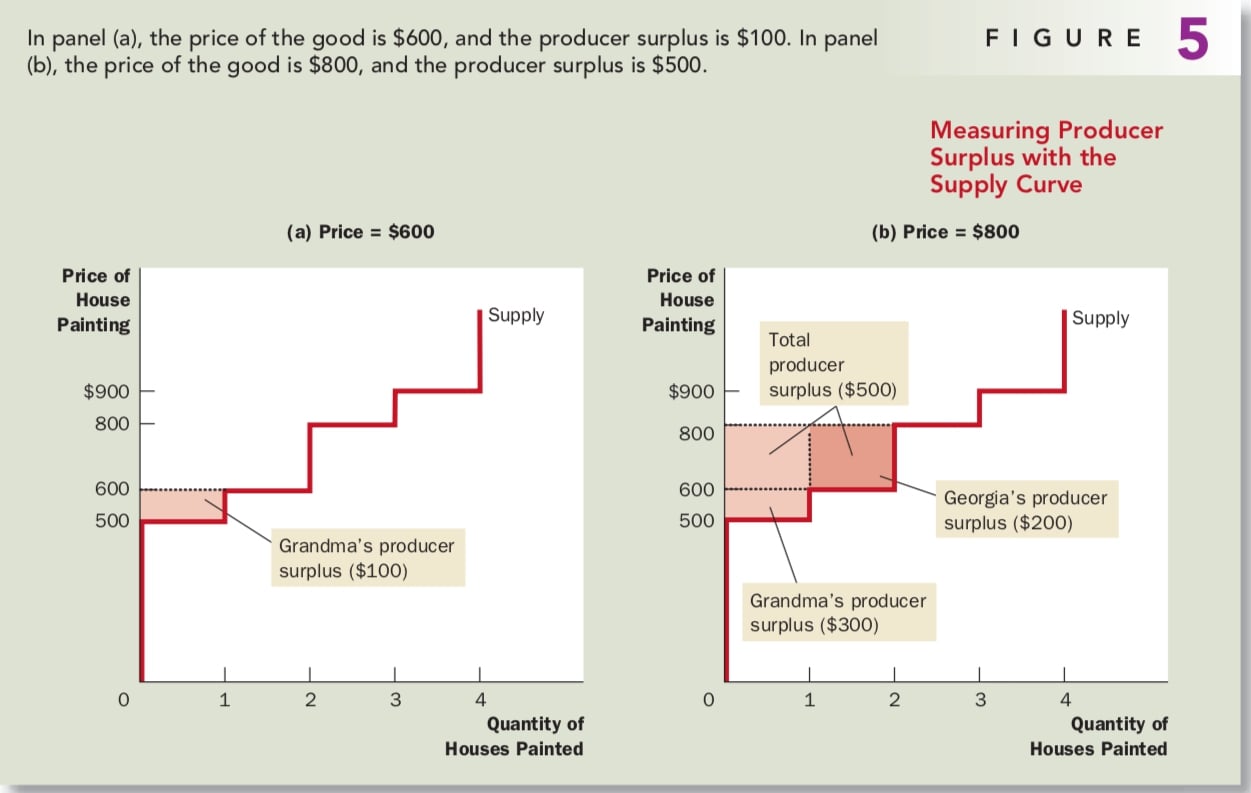
How A Higher Price Raises Producer Surplus
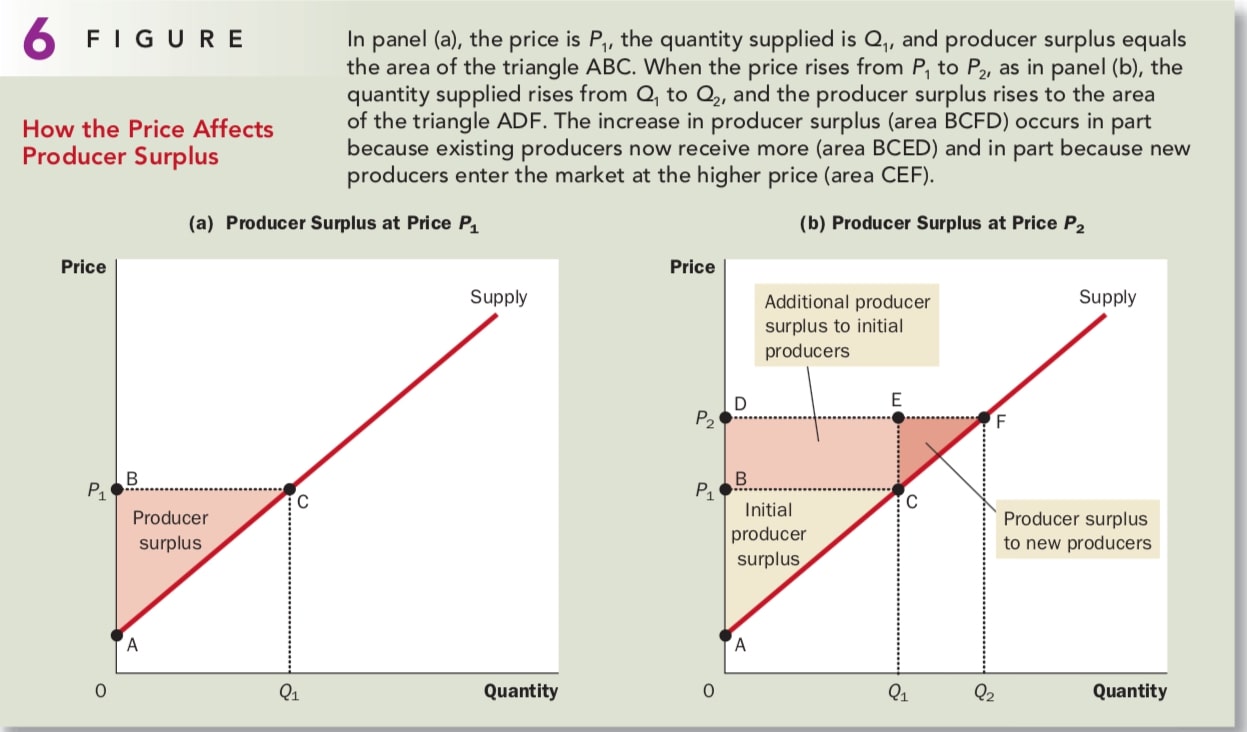
Figure 6 shows a typical upward-sloping supply curve that would arise in a market with many sellers. In panel (a), the price is P1, and producer surplus is the area of triangle ABC. Panel (b) shows what happens when the price rises from P1 to P2. Producer surplus now equals area ADF.
MARKET EFFICIENCY
One possible way to measure the economic well-being of a society is the sum of consumer and producer surplus, which we called total surplus. Consumer surplus is the benefit that buyers receive from participating in a market, and producer surplus is the benefit that sellers receive. It is therefore natural to use total surplus as a measure of society’s economic well-being.
1 | Total surplus = Value to buyers - Cost to sellers |
Total surplus in a market is the total value to buyers of the goods, as measured by their willingness to pay, minus the total cost to sellers of providing those goods. If an allocation of resources maximizes total surplus, we say that the allocation exhibits efficiency.
In addition to efficiency, the social planner might also care about equality— that is, whether the various buyers and sellers in the market have a similar level of economic well-being.
Evaluating The Market Equilibrium
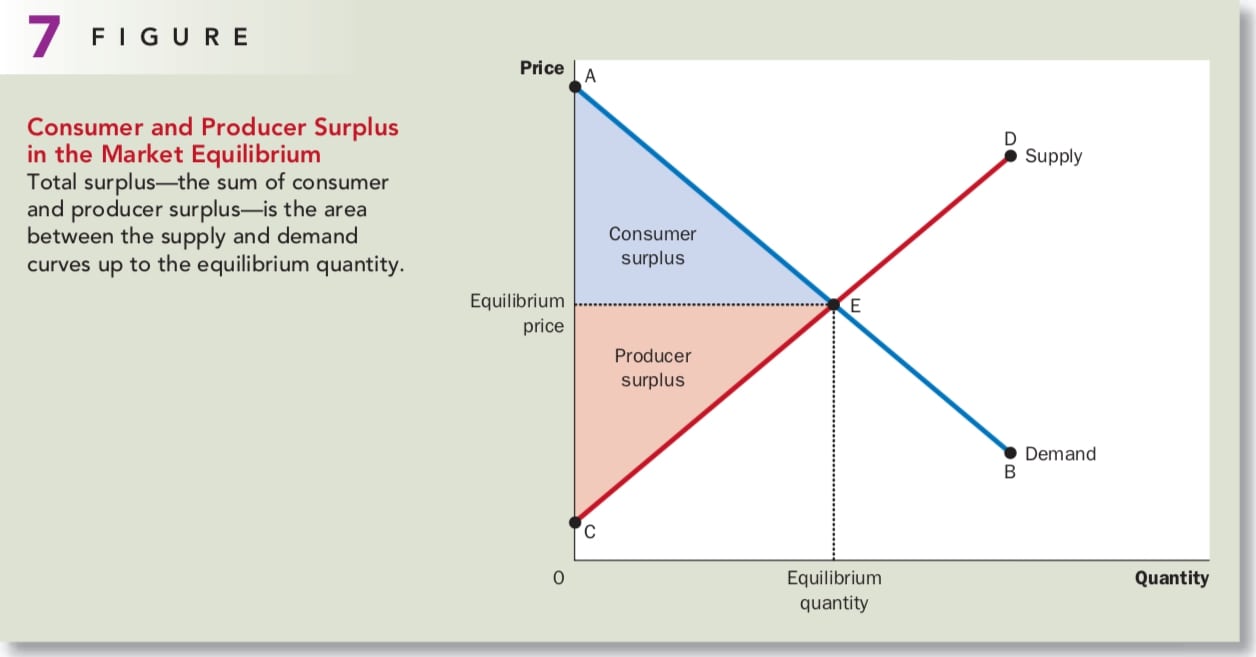
Figure 7 shows consumer and producer surplus when a market reaches the equilibrium of supply and demand curve. The total area between the supply and demand curves up to the point of equilibrium represents the total surplus in this market. Those buyers who value the good more than the price choose the buy the good; buyers who value it less than the price do not. Similarly, those sellers whose costs are less than the price choose to produce and sell the good.
These observations lead to three insights about market outcomes: 1. Free markets allocate the supply of goods to the buyers who value them most highly, as measured by their willingness to pay. 2. Free markets allocate the demand for goods to the sellers who can produce them at the least cost. 3. Free markets produce the quantity of goods that maximizes the sum of consumer and producer surplus.
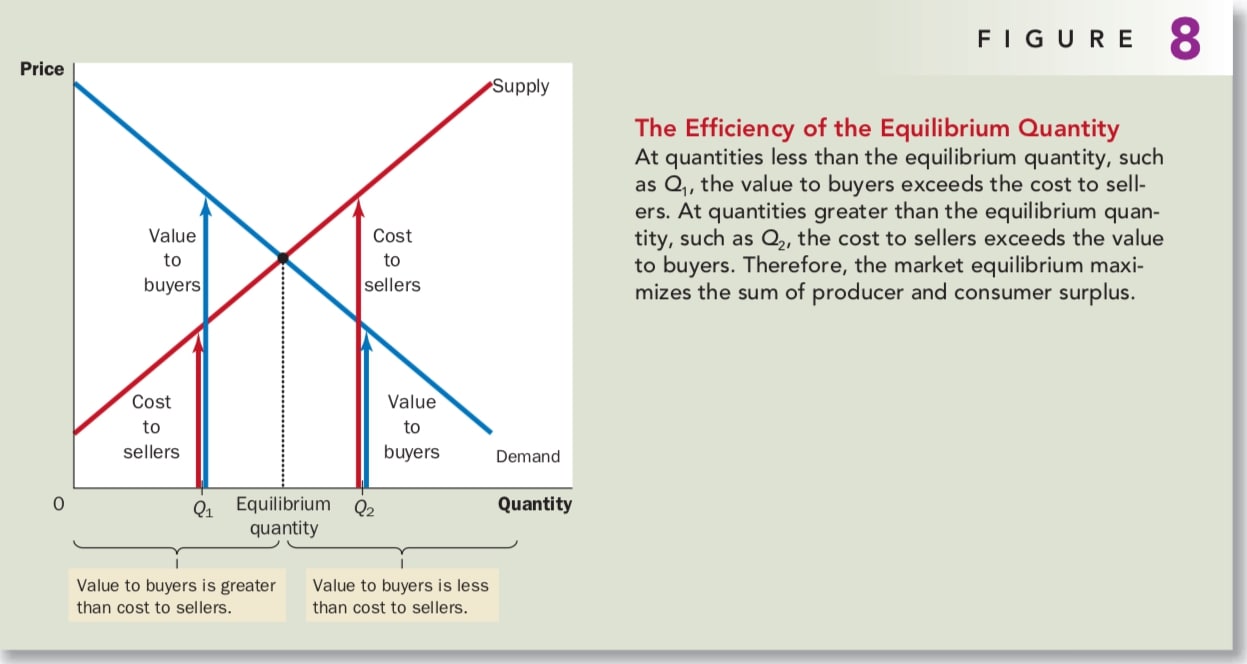
Figure 8 illustrates why this is true. At any quantity below the equilibrium level, such as Q1, the value to the marginal buyer exceeds the cost to the marginal seller. As a result, increasing the quantity produced and consumed raises total surplus. This continues to be true until the quantity reaches the equilibrium level. Similar situations happed when the quantity larger than the equilibrium level.
Therefore, the equilibrium outcome is an efficient allocation of resources.
CONCLUSION
This chapter introduced the basic tools of welfare economics — consumer and producer surplus — and used them to evaluate the efficiency of free markets. We showed that the forces of supply and demand allocate resources efficiently.
A word of warning is in order. To conclude that markets are efficient, we made several assumptions about how markets work. First, our analysis assumed that markets are perfectly competitive. In the world, however, competition is sometimes far from perfect. Second, out analysis assumed that the outcome in a market matters only to the buyers and sellers in that market. Yet, in the world, the decisions of buyers and sellers sometimes affect people who are not participants in the market at all. Pollution is the classic example. Such side effects, called externalities, cause welfare in a market to depend on more than just the value to the buyers and the cost to the sellers.